Dashboard
What is a Dashboard
A dashboard is a graphical user interface that offers a visually appealing summary of metrics, data summaries, and key performance indicators. It usually compiles data from multiple sources into a single display, making it easy for consumers to track and evaluate data patterns.
Importance of a Dashboard
Dashboards are crucial instruments for making decisions because they let users evaluate the health and effectiveness of organizations, processes, or systems in real-time. They support data-driven decision-making, offer real-time insights, and assist in identifying areas in need of maintenance or improvement. Dashboards improve communication within teams and departments, expedite information access, and increase openness.
How to check Dashboard
-
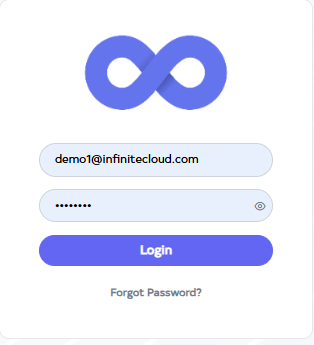
Go to Cloud platform and go there fill the details and then click on login button
-
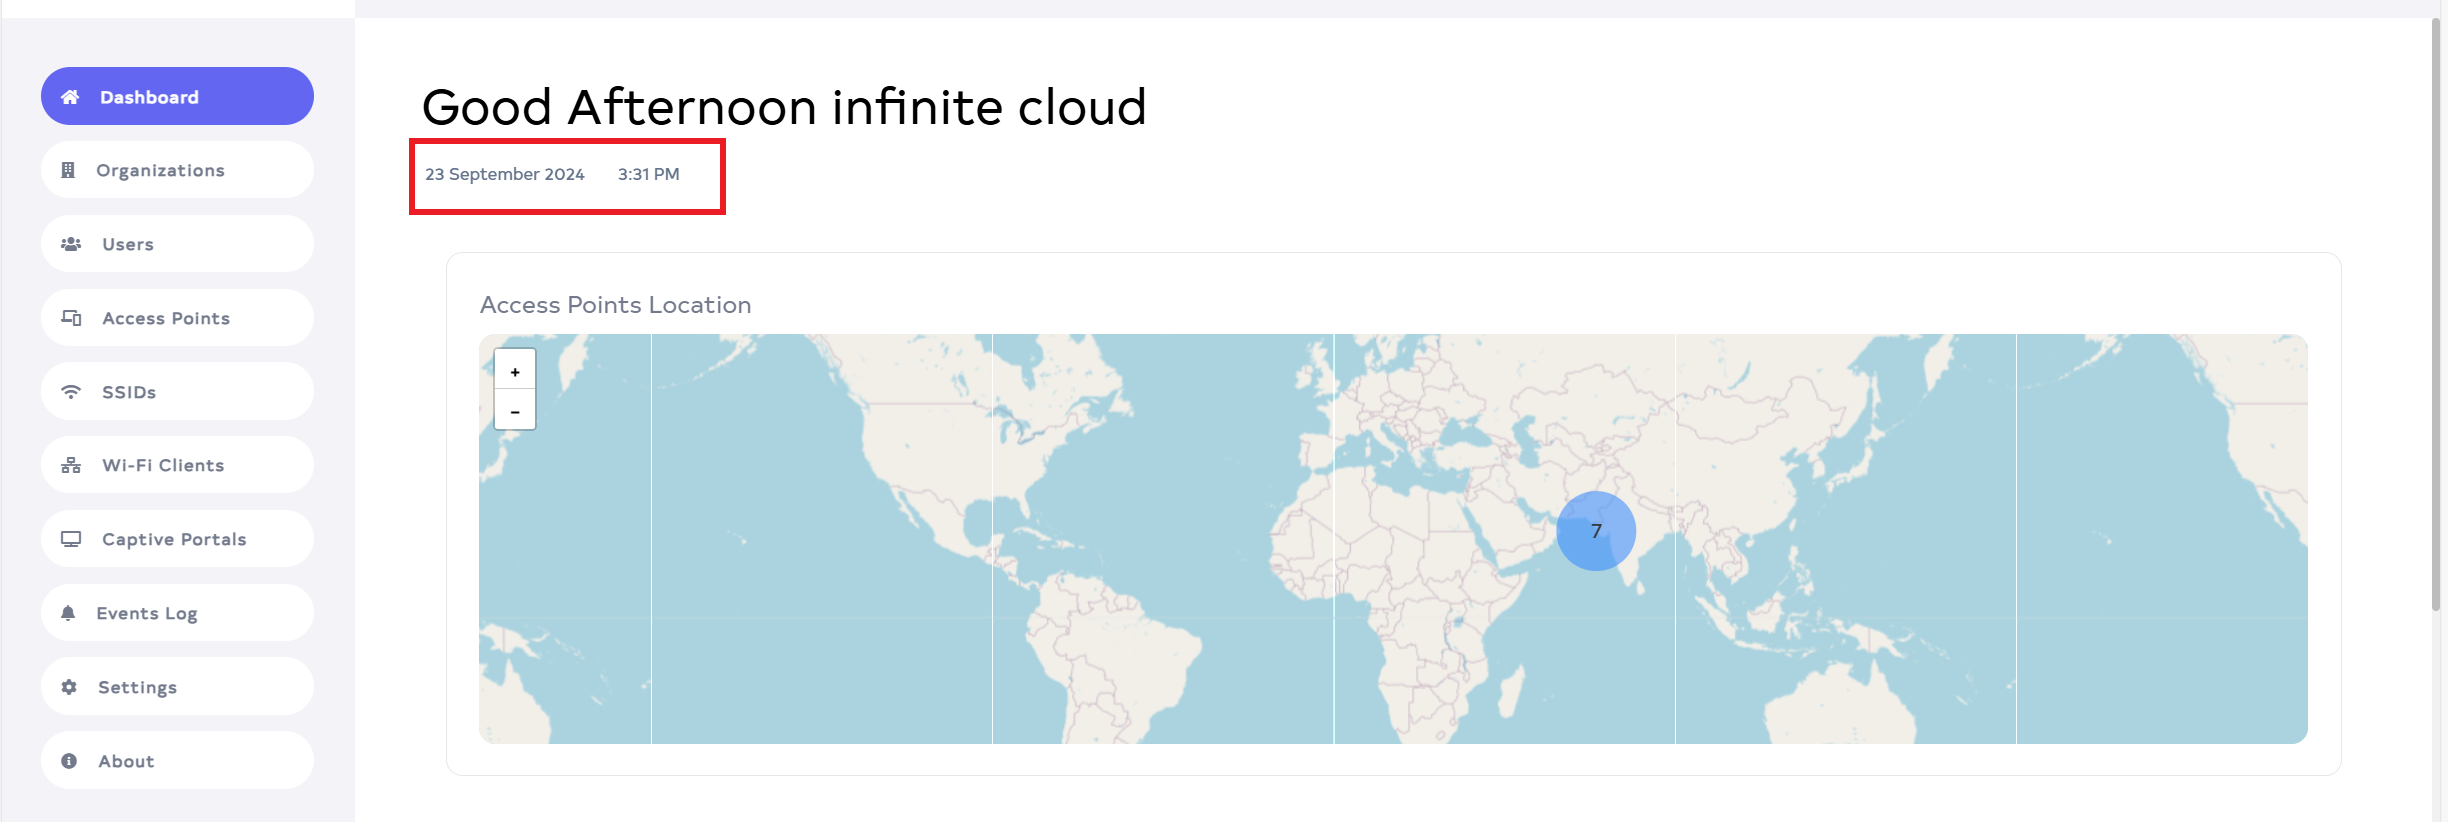
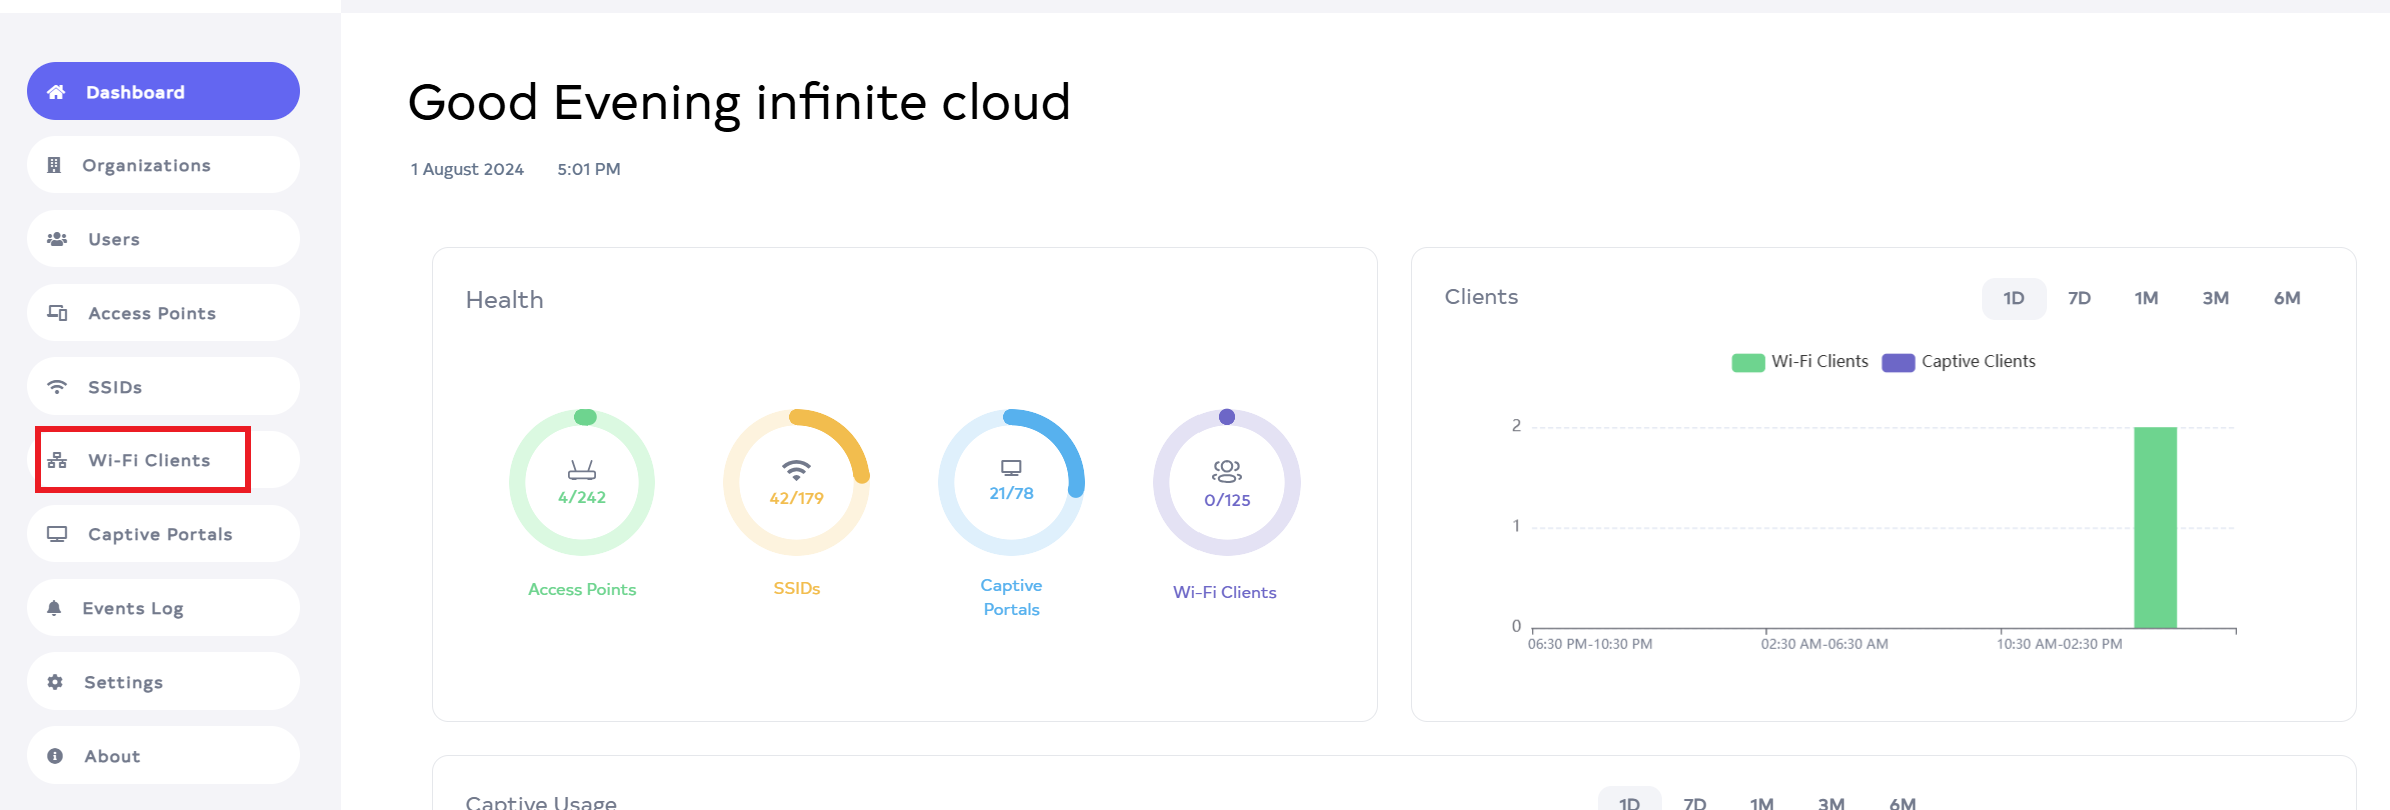
After login, the Dashboard will appear by default. The date and time displayed on the dashboard will remain constant, reflecting the exact timestamp when the user logged in. This timestamp will not be updated dynamically and will continue to display the original login time and date until the session is refreshed or a new login is performed.
-
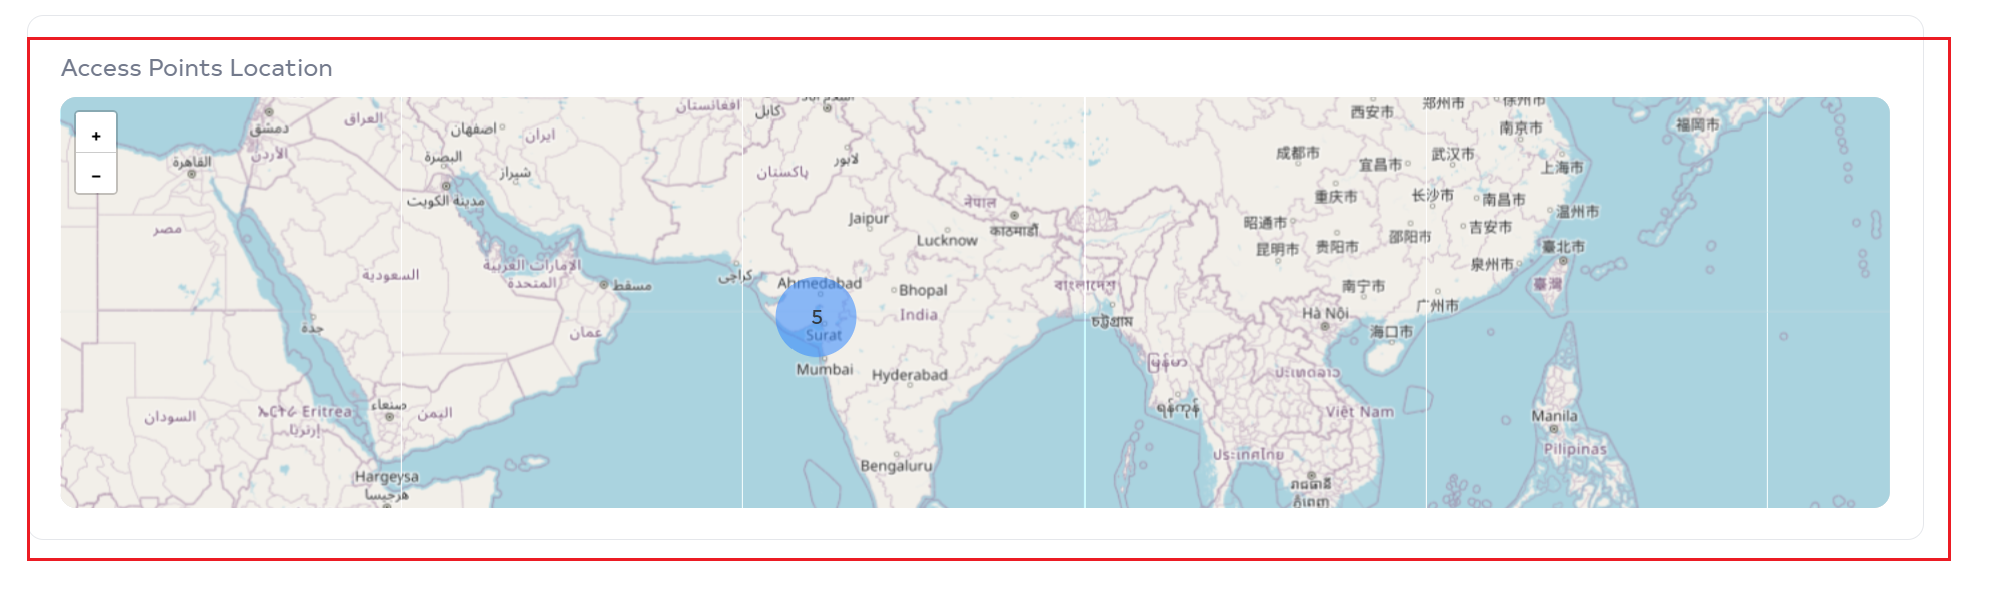
A Map is displayed, summarizing the access points. Clicking on a blue circle on the map reveals the number of access points, currently active status and their specific locations.
-
Health will be seen there. There you will find all the summaries in Health.
Access piont:- Shows total number of Access Point and how many uses.
SSIDs:- Shows how many SSIDs there are and how many are connected.
Captive Portal:- It shows that there are total 60 Captive Portal and 7 people are connected in it.
Wifi client:- Shows how many WiFi Clients there are and how many they use.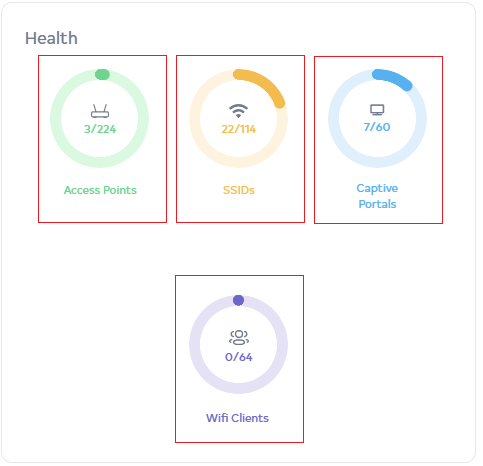
-
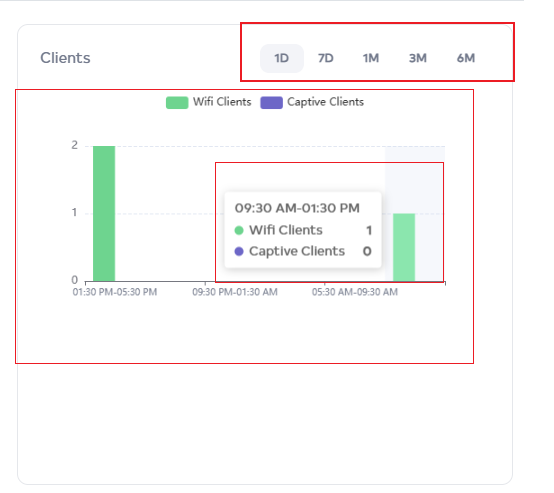
Among the Clients there will be found, WiFi clients and Captive clients. There it shows a summary of how many people connected using Wifi and how many used Captive Portals. You can see the summary of 1D, 7D, 6M, and 1M.
-
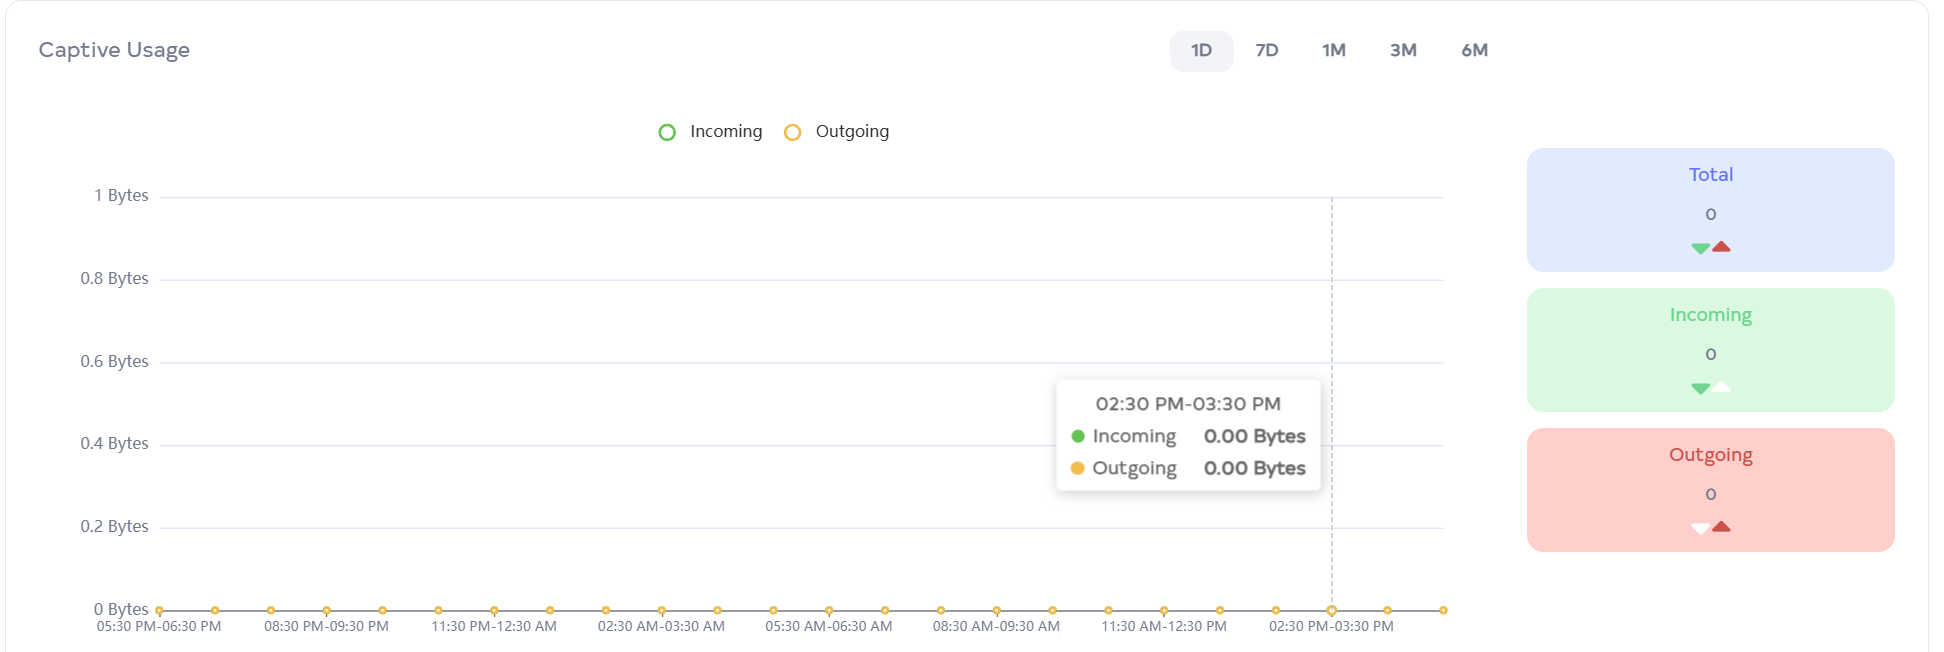
Scroll on the section Captive Usage.This section summarizes the total usage by captive clients, detailing both incoming and outgoing data. It offers an overview of how much data captive clients have used overall.
-
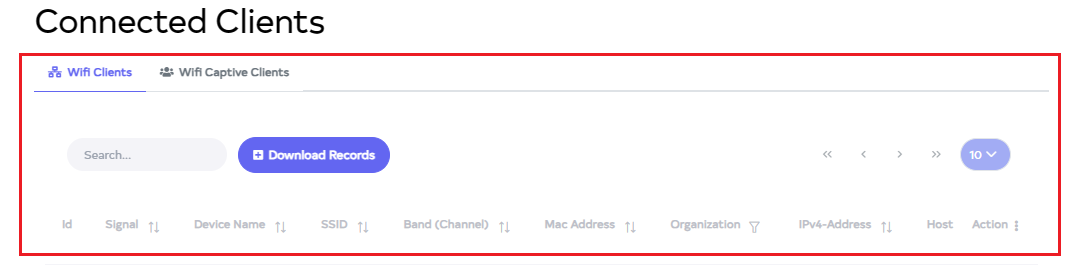
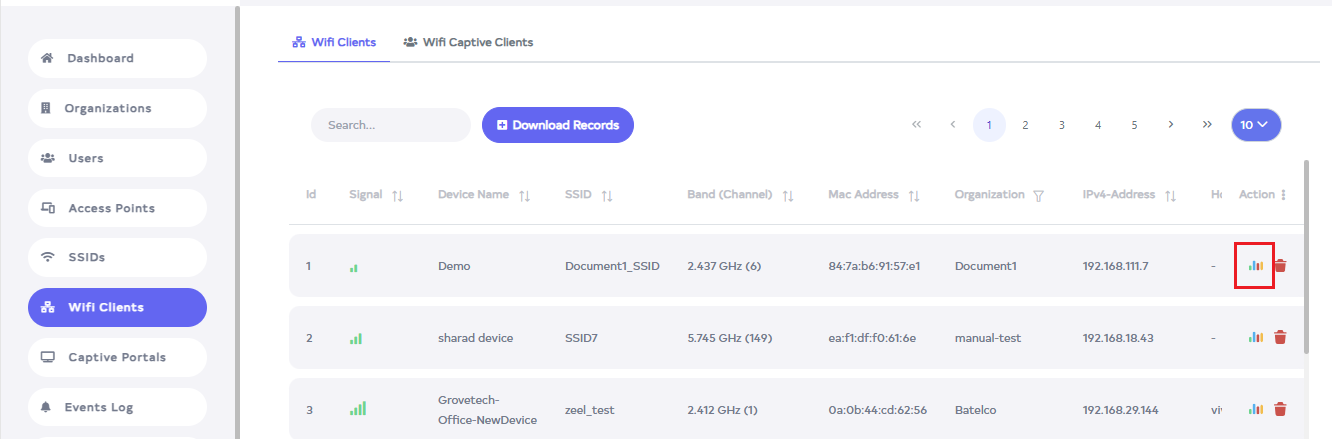
Go to the Wifi Client menu.
-
After there go to view client usage.
-
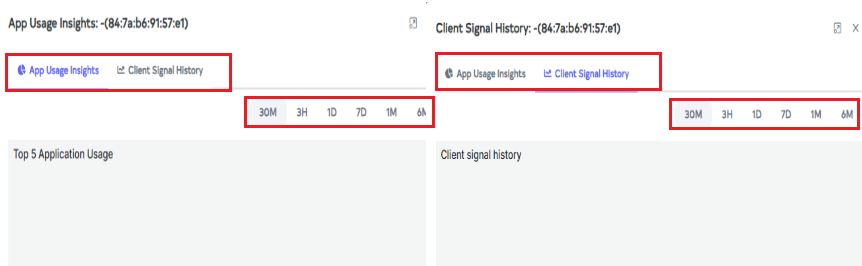
App usage insight and client signal history will be displayed, with summaries available for 1 minute, 3 hours, 1 day, 7 days, 1 month, and 6 months.
-
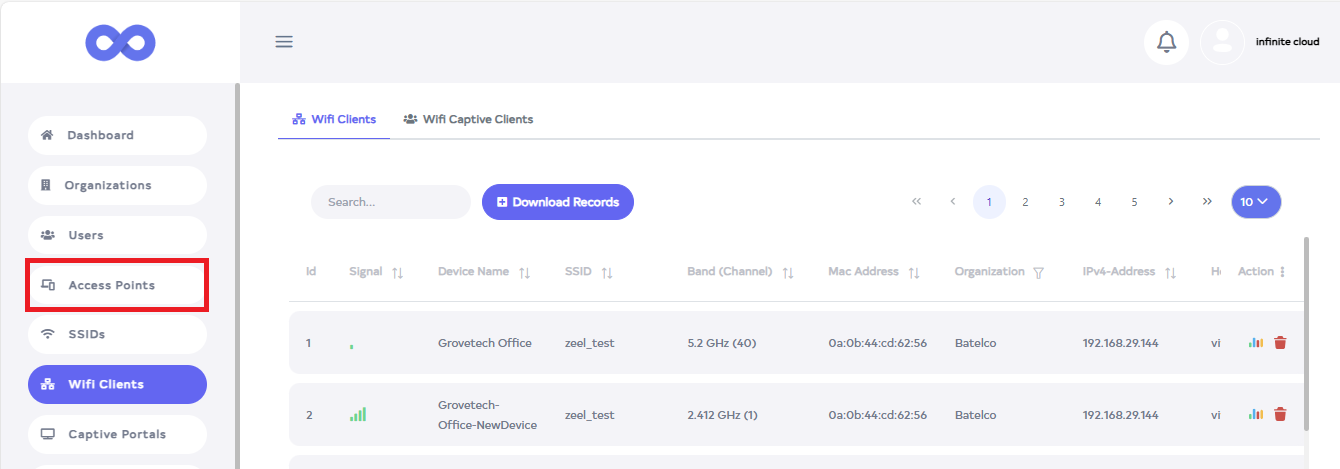
Go to the Access Point menu.
-
After going to Access Point man go to Statistics.

-
The WiFi network usage summary will be displayed, including TX and RX.

-
Scroll down to see the details of the connected clients, including the number of Wi-Fi clients and Wi-Fi captive clients.